Making the Most of Your Library’s Data
When it comes to data-driven planning and decision-making, libraries often feel overwhelmed. But here’s the thing: most libraries are already sitting on a wealth of useful data. The real challenge isn’t finding more information—it’s analyzing what’s already available and then making the best use of it.
At ReThinking Libraries (RTL), Rob Cullin and Janet Nelson often remind library leaders that data doesn’t have to be complicated. “What we do is try to make it as easy as possible: use what they already have at their disposal,” Nelson explained in a recent conversation. That shift in perspective—from “what are we missing?” to “what do we already know?”—can open up fresh insights for everything from strategic planning to community engagement.
Data Libraries Already Have

It’s easy to overlook the variety of data sources at your fingertips. Some of the most common include:
Annual reports – IMLS reports or state library agency data often go much deeper than the top-level numbers published nationally.
Library statistics – circulation, door counts, program attendance, reference questions, and other routine stats can be repurposed into new insights.
Previous surveys – feedback from residents, whether a few years old or more recent, often contains trends worth revisiting.
Community reports – local government documents may reveal priorities where the library has a natural role to play. Searching for the word library can be eye-opening.
Specialized software tools – platforms like OrangeBoy, CollectionHQ, and others add another layer of usage and demographic analysis.
Together, these sources create a baseline of data that can be expanded through benchmarking, community engagement, or more detailed demographic studies.
Benchmarking: Finding Meaning Through Comparison

Data in isolation can be hard to interpret. Benchmarking provides the context. Strategic planners frequently create a single list of benchmark libraries for comparison. In contrast, RTL uses IMLS data to develop multiple benchmarking cohorts:
Local comparisons within the same state
National peers with similar size or demographics
Elite usage libraries as aspirational examples
Custom cohorts when appropriate. For example, they created a list of SEC university communities for Tuscaloosa, Alabama, and a list of high-tourism communities for Door County, Wisconsin.
This layered approach avoids one-size-fits-all comparisons. Looking at elite libraries, for example, doesn’t just show where you stand—it provides a vision of what’s possible with increased investment.
Gathering Fresh Data from the Community

Of course, statistics only go so far. Direct input from residents adds depth and nuance. Surveys and focus groups remain staples, but Nelson stresses creativity when it comes to reaching people. A few proven approaches include:
Partnering with other organizations – Ask city government, schools, or social services to help distribute surveys through water bills, newsletters, or events.
Intercept activities – Set up quick dot-voting exercises at bus stops, farmers markets, or high school lunch hours. A handful of colorful stickers can yield valuable insights.
Post-it walls – Pose a single question in the library and invite comments.
Leveraging library space – Hosting city government meetings in your library gives an opportunity to seek input from local leaders.
An important reminder: while libraries often focus on engaging non-users, don’t forget your regular patrons. Understanding their needs—and showing you value them—remains just as critical.
When Data Shifts the Conversation
Data doesn’t just inform plans; sometimes it changes minds. Cullin points to Tuscaloosa, where community members weren’t initially concerned about library funding. Once benchmarks showed the library lagging behind its SEC peers, residents began advocating to stave off cuts.
In Grand County, Colorado, data revealed the system was on the edge of “elite usage” status. Staff who thought they were just average suddenly realized they were doing exceptionally well.
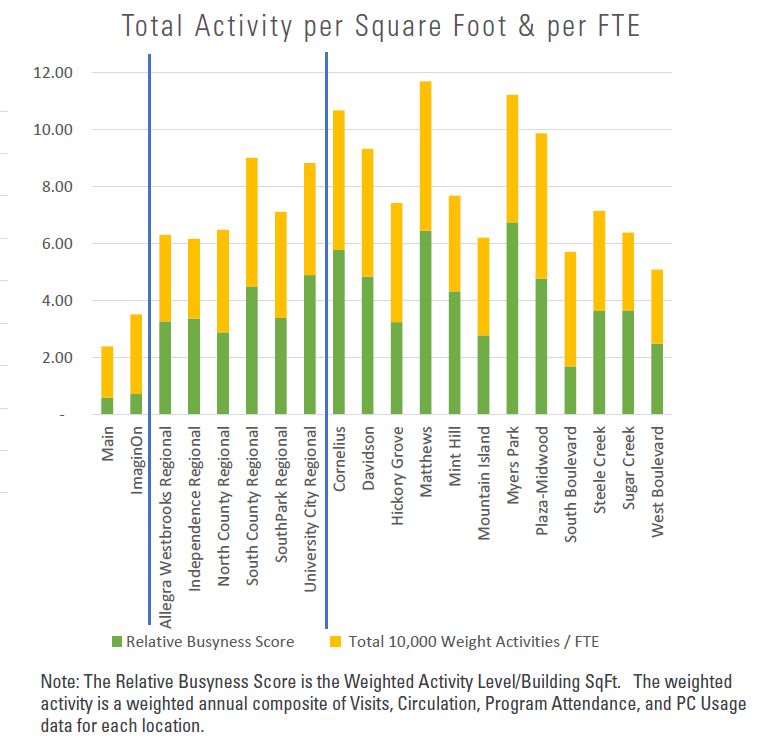
In other communities, staff are surprised to learn that the smallest libraries are often the busiest in terms of activity per staff.
And in many communities, survey data has highlighted the importance of library space—lighting, seating, and noise levels—issues that might not have surfaced otherwise. In one case, a community’s passion for food led to plans for a culinary literacy center.
Even staff surveys can surprise. Sometimes dissatisfaction surfaces, leading to a stronger focus on staff needs—a priority the public often embraces wholeheartedly.
Keeping Data Alive Throughout the Plan
Too often, data gathering ends once a plan is written. RTL encourages libraries to keep data at the center of implementation. By returning to the same benchmarks and survey questions, libraries can measure progress over time, adjusting course as needed.
“Everyone wants to make their plans more measurable,” Cullin noted. But without ongoing data collection, it’s hard to demonstrate progress to boards, funders, or the community itself. Using data as both a baseline and a regular check-in ensures plans stay on track.
Exploring New Tools
While libraries already have plenty of data, new tools can extend their usefulness. RTL recently partnered with Growing Libraries, a platform that combines mapping, psychographic analysis, and targeted outreach.
The software connects to a library’s ILS to map cardholders and identify households without cards. It segments communities into lifestyle categories—more than just age and gender—and even supports marketing campaigns, from postcards to targeted emails.
Libraries working with RTL can have the initial $1500 setup fee for Growing Libraries waived. Annual fees for the product are based on population size and are very affordable.
Cullin and Nelson are clear: RTL doesn’t benefit financially from the partnership. Instead, they see it as another option for libraries ready to dig deeper, especially those interested in engaging non-users or strengthening fundraising. For libraries curious to learn more, Growing Libraries is hosting an upcoming webinar: Increasing Cardholder Numbers Through Data-Driven Outreach on September 25, 2025 at 12 PM CDT. Check out the press release for further information.
Making Data Work for You

The biggest takeaway? You don’t need to start from scratch. Begin with the data you already have, look at it in new ways, and then layer in comparisons, surveys, and community conversations. Whether you’re defending your funding, planning for space improvements, or simply trying to better understand your patrons, data gives you both evidence and inspiration.
As Cullin and Nelson emphasize, it’s not about the quantity of data, but how you use it. And chances are, your library already has more at its disposal than you realize.